

But despite that, average house prices held up across England – even if there was a drop in sales.
In Scarbrough, prices rose by 2.8 per cent in the year to September 2020, though some areas reported much higher rises than others. Across Yorkshire and The Humber, prices rose by 3.2 per cent.
The ONS also publishes house price figures by Middle Layer Super Output Areas (MSOAs) – small geographic areas containing an average of 7,200 people. These show 10 of the 14 MSOAs that make up Scarborough saw a rise in house prices over the same period.
Here we reveal which neighbourhoods saw the strongest growth in the year to September 2020.
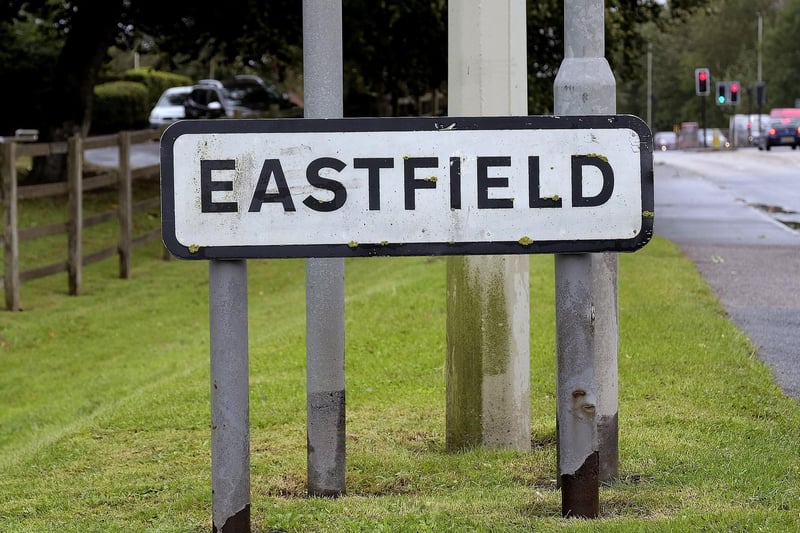
1. Eastfield, Crossgates & Seamer
In Eastfield, Crossgates & Seamer the average price fell to £162,493, down by 4.2 per cent on the year to September 2019. Overall, 73 houses changed hands here between October 2019 and September 2020, a drop of 34 per cent. Photo: Richard Ponter
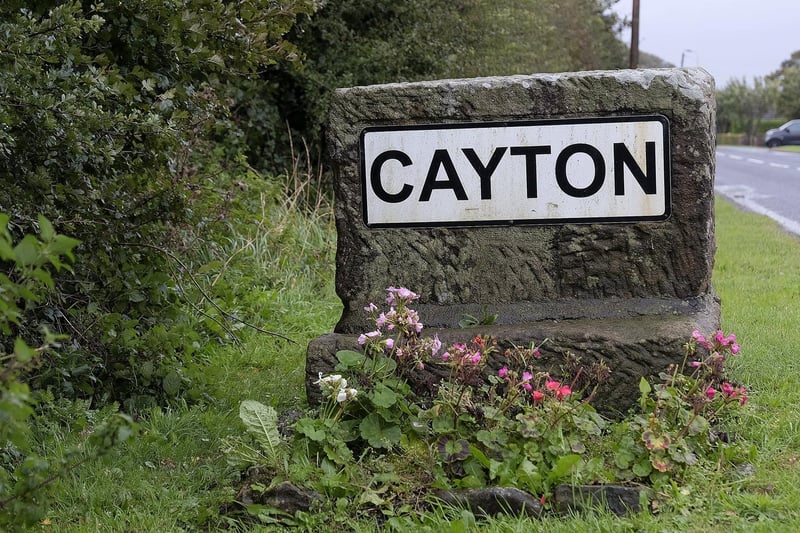
2. Wheatcroft & Cayton
In Wheatcroft & Cayton the average price fell to £172,499, down by 2.6 per cent on the year to September 2019. Overall, 131 houses changed hands here between October 2019 and September 2020, a drop of 31 per cent. Photo: Richard Ponter
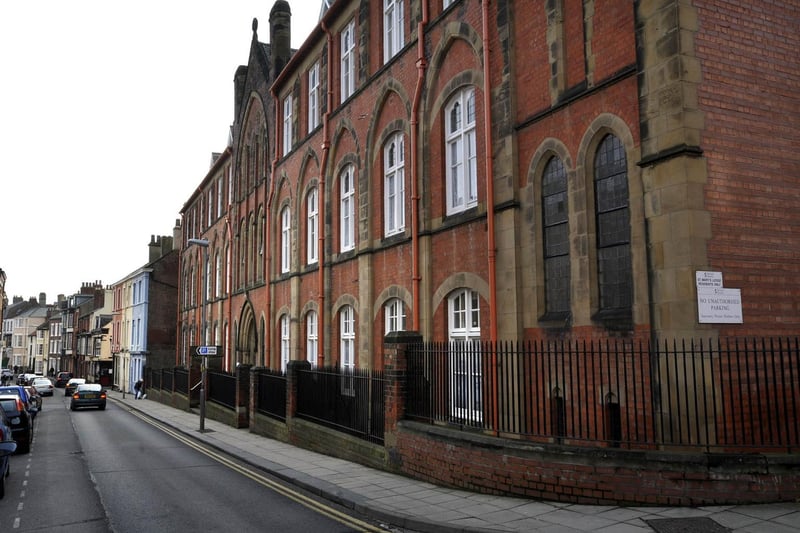
3. Scarborough Town and North Bay
In Scarborough Town and North Bay the average price fell to £134,163, down by 1.5 per cent on the year to September 2019. Overall, 95 houses changed hands here between October 2019 and September 2020, a drop of 36 per cent. Photo: Richard Ponter
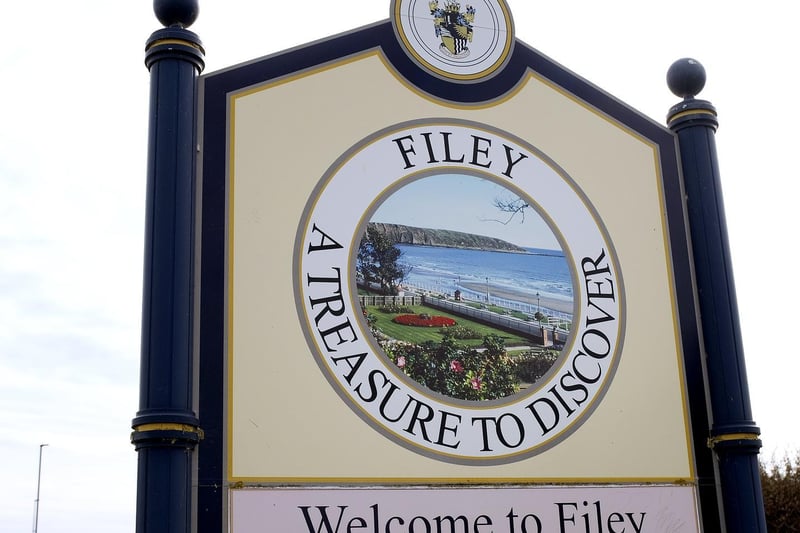
4. Filey & Hunmanby
The next biggest price hike was in Filey & Hunmanby where the average price rose to £169,434, up by 0.5 per cent on the year to September 2019. Overall, 211 houses changed hands here between October 2019 and September 2020, a drop of 28 per cent. Photo: Richard Ponter