

The ONS has divided deaths occurring between 1 March 2020 and 17 April 2020 and registered by 18 April 2020 into middle layer super output areas (MSOAs) based on each patient's home address. MSOA are areas with similarly sized populations that remain stable over time. The figures refer to deaths where Covid-19 was the underlying cause or was mentioned on the death certificate as a contributory factor and exclude deaths of non-residents. For comparison, the total number of deaths of all causes during the same time period is also included below.
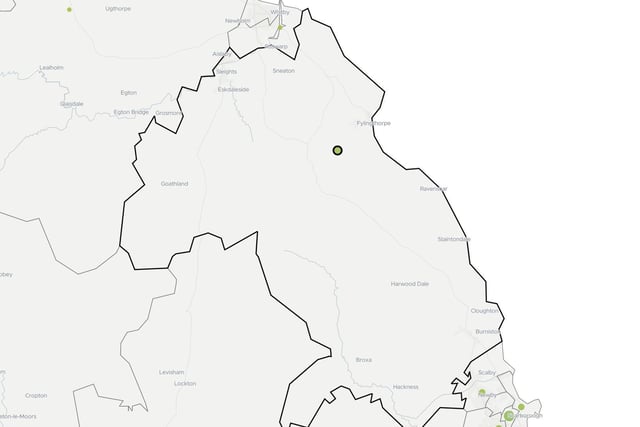
5. Burniston, Sleights and Fylingdales
Two deaths related to Covid-19 were recorded in Burniston, Sleights and Fylingdales. There were a total of 15 deaths of residents in this area in the timeframe. Covid deaths were 13 per cent of the total. Photo: ONS
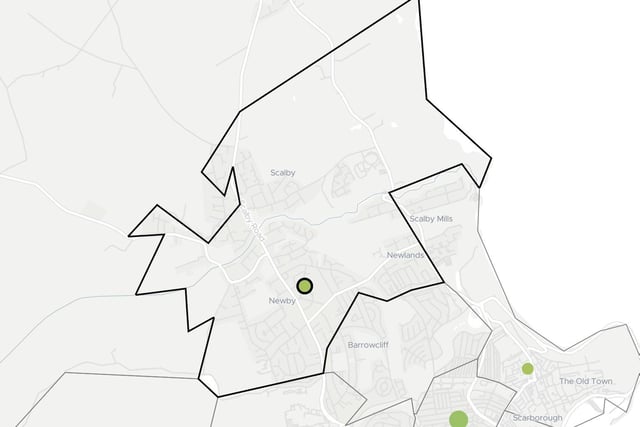
6. Newby and Scalby
Two deaths related to Covid-19 were recorded in Newby and Scalby. There were a total of 16 deaths of residents in this area in the timeframe. Covid deaths were 13 per cent of the total. Photo: ONS
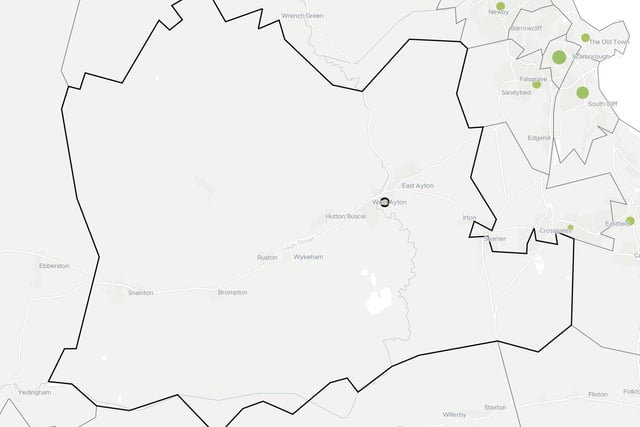
7. Ayton and Snainton
One death related to Covid-19 was recorded in Ayton and Snainton. There were a total of 9 deaths of residents in this area in the timeframe. Covid deaths were 11 per cent of the total. Photo: ONS
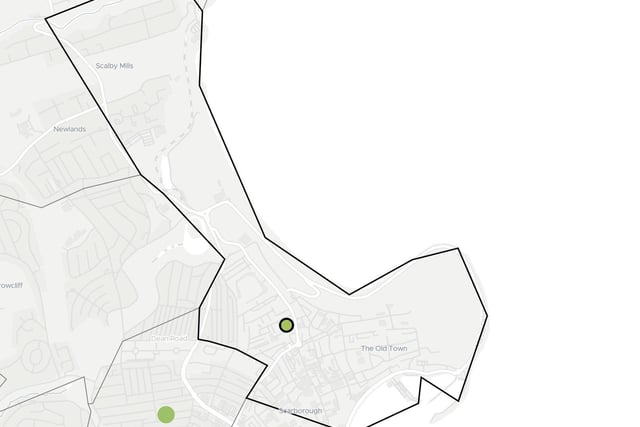
8. Scarborough Town and North Bay
Two deaths related to Covid-19 were recorded in Scarborough Town and North Bay. There were a total of 8 deaths of residents in this area in the timeframe. Covid deaths were 25 per cent of the total. Photo: ONS