
But cases of Coronavirus are on the rise across the country. The latest government figures show every area in the local authority of Scarborough saw a rise in infections in the latest seven-day period. Scarborough recorded 665 cases in the seven days to 16 July, a rate of 611.5 per 100,000 people. As restrictions now lift in England, we reveal which neighbourhoods saw the biggest rise in case rates per 100,000 people.
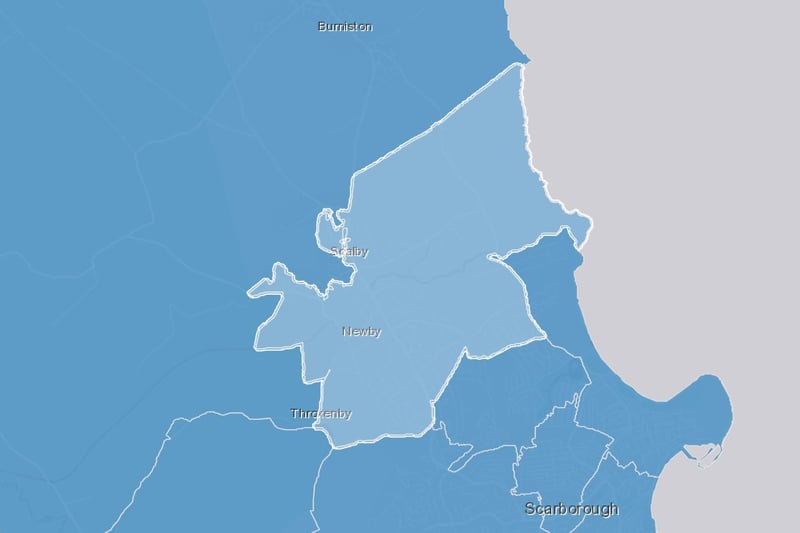
5. Newby and Scalby - 145% increase
Newby and Scalby has seen rates of positive Covid cases rise by 145%, from 315.5 per 100,000 to 772.3 per 100,000. Photo: ONS
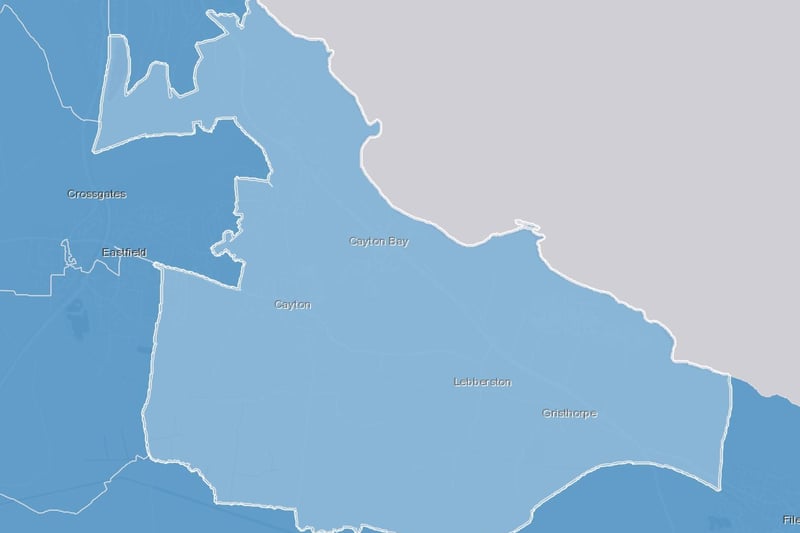
6. Wheatcroft and Cayton - 117% increase
Wheatcroft and Cayton has seen rates of positive Covid cases rise by 117%, from 243.3 per 100,000 to 527.2 per 100,000. Photo: ONS
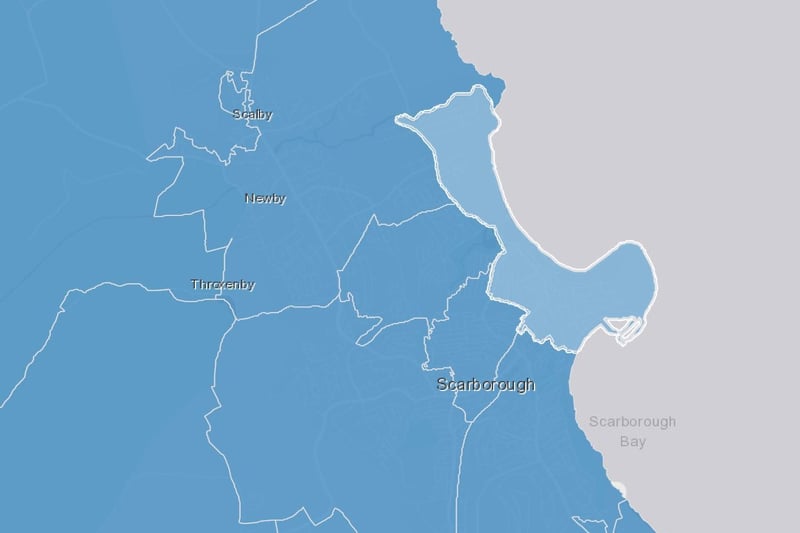
7. Scarborough Town and North Bay - 96% increase
Scarborough Town and North Bay has seen rates of positive Covid cases rise by 96%, from 295.6 per 100,000 to 578.4 per 100,000. Photo: ONS
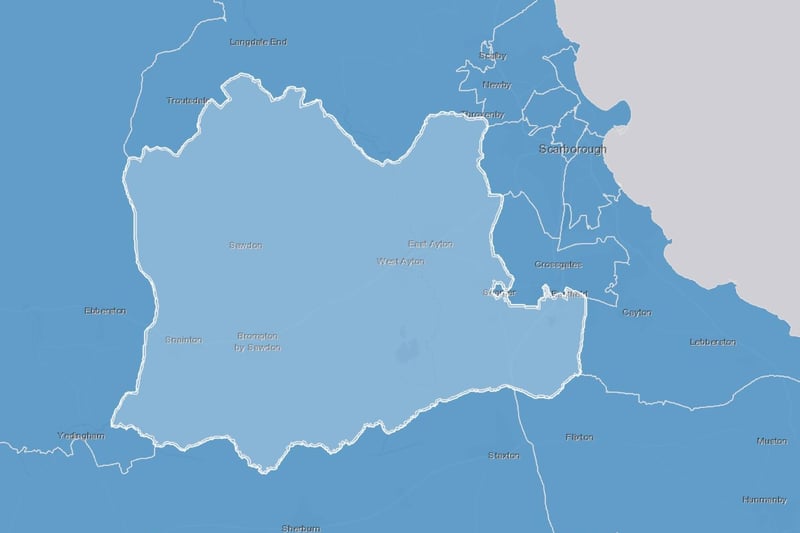
8. Ayton and Snainton - 90% increase
Ayton and Snainton has seen rates of positive Covid cases rise by 90%, from 156.6 per 100,000 to 297.5 per 100,000. Photo: ONS