


Data has been collected from the Index of Multiple Deprivation (IMD) which was most recently updated in September 2019.
The IMD is the official measure of deprivation in England. The IMD combines information about seven different types of deprivation to produce an overall relative measure of deprivation. In the IMD 2019, there are 39 datasets (indicators) organised into the seven domains of deprivation.
The IMD measures deprivation for small areas named Lower Super Output Areas (LSOAs). Each LSOA is estimated to contain around 650 households and can span over a few geographically close streets. These areas are ranked with a number to measure deprivation, with 1 being the most deprived.
LSOAs do not correspond exactly to postcodes, so the postcodes and street names given in this article are approximate.
The following 15 are the most deprived LSOAs in and around Scarborough.
They have been ranked according to their deprivation ranking in the local area, beginning with the most deprived.
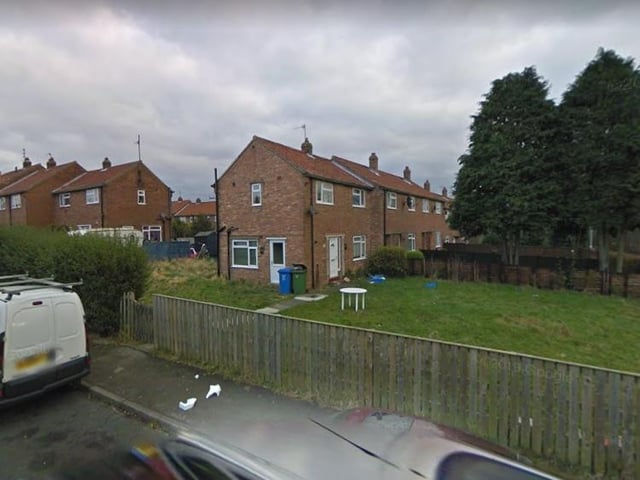
5. Eastfield, Scarborough
Containing approximately 510 households, this LSOA covers YO11 3H postcodes.This includes homes on streets like Caymer Road, Herdborough Road and Hertford Close. | other Photo: Google
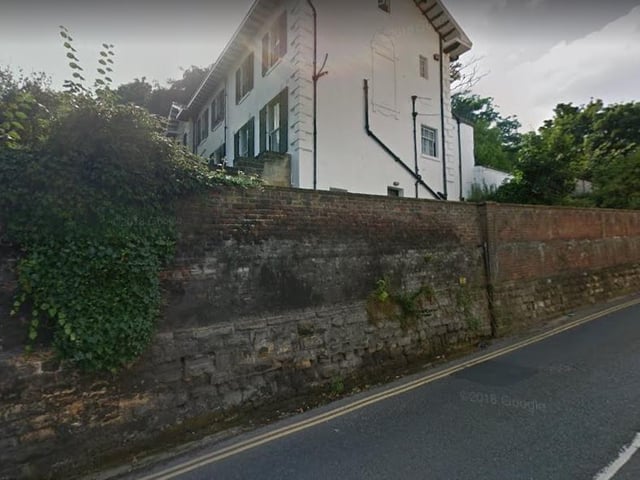
6. Scarborough
Close to the central station, this LSOA also covers some YO11 1 postcodes along with some YO11 2 postcodes. Streets that fall into it include Vernon Road, Westborough and York Place. | other Photo: Google
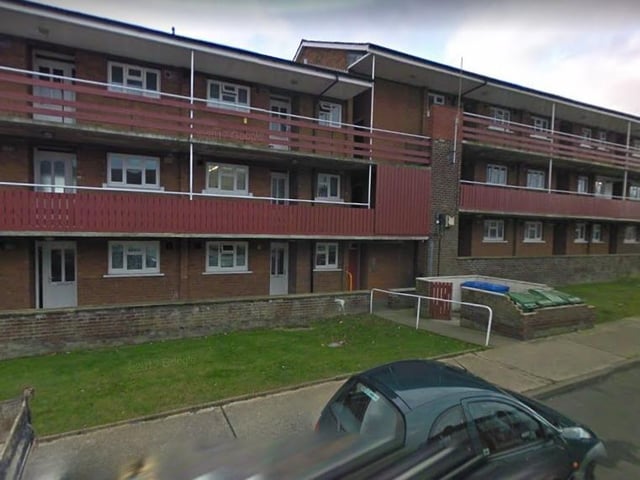
7. Scarborough
More YO11 3 postcodes are covered by this LSOA in Eastfield, which is the seventh most deprived in the area. Streets like High Street, Link Walk and Sweetbecks Close are included. | other Photo: Google
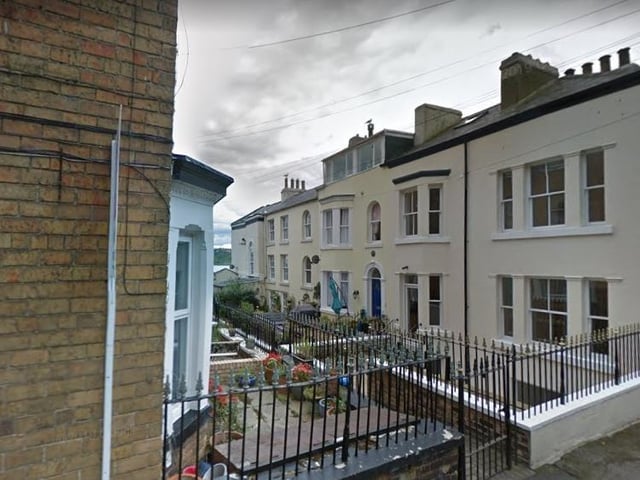
8. Scarborough
More central YO11 1 Scarborough postcodes fall into this deprived LSOA. It includes Marine Drive, Princess Street and Quay Street. | other Photo: Google