As part of the 2021 census, households in England and Wales were classified in terms of four different "dimensions of deprivation”.
Households were considered to be deprived if they met one of the four following criteria:
Employment: if any member of the household, who is not a full-time student, is either unemployed or long-term sick
Education: if no person in the household has at least five or more GCSE passes or equivalent and no-one aged 16 to 18 years is a full-time student
Health and disability: if anyone in the household is in bad or very bad health or is disabled
Housing: if the home is either overcrowded, in a shared dwelling or has no central heating
Across England, the council areas with the highest proportion of households that were not deprived included Elmbridge in Surrey (61.9%), Wokingham in Berkshire (61.5%) and Richmond upon Thames in London (61%).
Here are the areas of Scarborough and Whitby with the most non-deprived households.
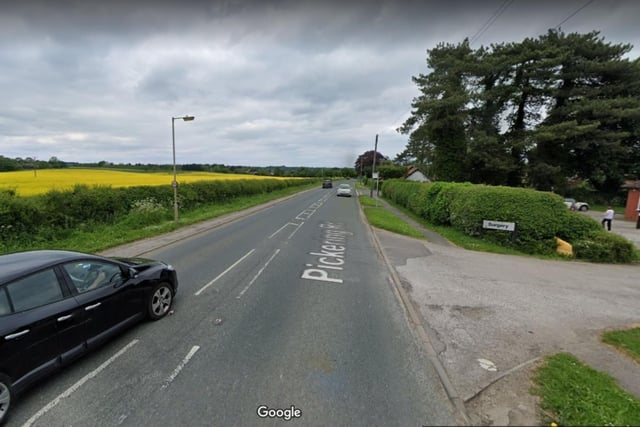
1. Least Deprived Areas
The least deprived area was Ayton and Snainton. Of the 2853 households in this area, 53.2% were not deprived. Photo: Google
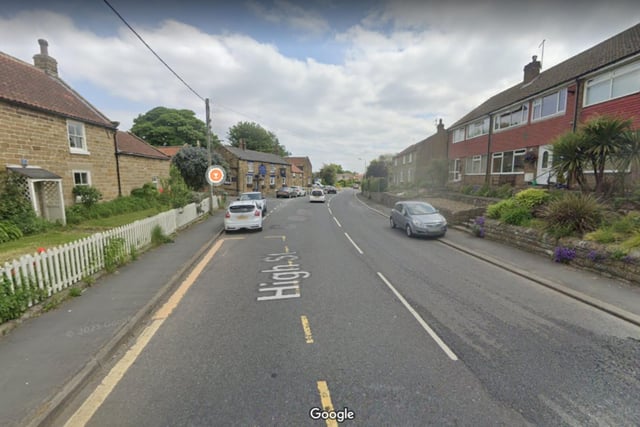
2. Least Deprived Areas
Of the 3760 households in Burniston, Sleights and Flyingdales, 52.4% were not deprived. Photo: Google
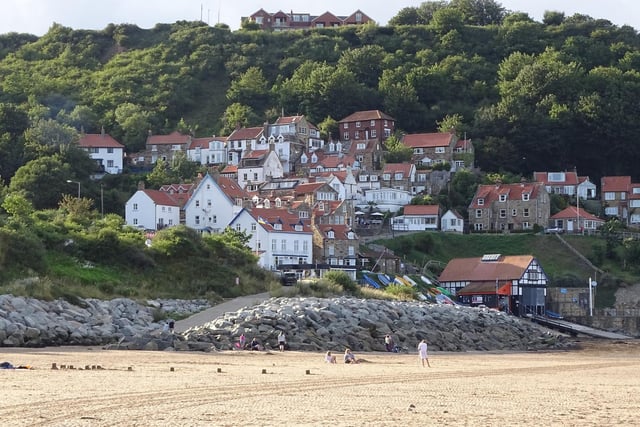
3. Least Deprived Areas
Of the 2969 households in Esk Valley and Runswick Coast, 51.6% were not deprived. Photo: David Clay
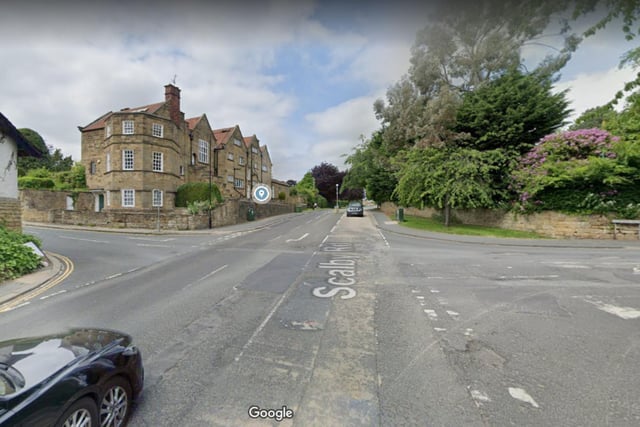
4. Least Deprived Areas
Of the 4205 households in Newby and Scalby, 51.2% were not deprived. Photo: Google
